The Annual Drama of the ‘Doc Fix’
By Uwe E. Reinhardt
“Medicare fees to be cut by 25% in 2011,” was the alarming headline in Internal Medicine News on Nov. 3. “Unless Congress acts,” the story continued.
After much suspense and breathless media reports, Congress did act.
So on Wednesday, just in the nick of time, President Obama signed into law a delay of one year for such a disastrous cut. Once again, near disaster had been averted in a recurring drama that reminds one of nothing so much as Kabuki theater.
After all, we had been near the brink many times before, several times in 2010 alone, and each time Congress shrank back from the abyss. By now, the movement is predictable.
But who, then, are the misanthropes who so frighten the daylights out of our senior citizens and the physicians who treat them — or may not?
It turns out not to be a human being at all!
Instead, it is just an innocent formula that Congress imposed on itself as part of the Balanced Budget Act of 1997.
The formula is widely known as the S.G.R., which stands for sustainable growth rate. It replaced what previously had been known as the volume performance standard, enacted as a companion to the Medicare fee schedule introduced as part of the Omnibus Budget Reconciliation Act of 1989.
As might be expected, the precise workings of the S.G.R. formula are daunting and would probably bore most readers; but those interested in the topic can find details online.
In a nutshell, the formula was intended to keep the overall growth of Medicare spending on physician services and certain items incidental to those services (laboratory tests, imaging services and physician-administered drugs) in line with the nation’s ability to pay for that care — measured by the growth of gross domestic product per capita — after accommodating spending increases justified by the growth in the Medicare population, by changes in the law, and by the cost of operating the typical medical practice. These practice costs are tracked by the Medicare Economic Index, widely known as M.E.I.
In effect, the S.G.R. formula forces Medicare to establish in one year a global budget for Medicare spending on physician services in the following year. If that budget is exceeded by actual spending, then the annual update in Medicare’s physician fees in subsequent years — i.e., the increases in the conversion factor for the Medicare fee schedule described in my earlier posts — is to be reduced so that, over time, cumulative actual spending will come in line with the cumulative spending allowed by the S.G.R. construct, both as of April 1, 1996.
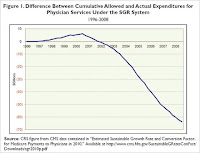
The chart below, from a Congressional Research Service analysis, shows how these cumulative spending numbers have behaved over time.

It is seen that in the early years after April 1, 1996, actual spending actually fell short of the budgeted spending allowed by the S.G.R. formula. Subsequent fee updates therefore exceeded the M.E.I. index (see the next chart below).
Since 2002, however, the trajectory of the two cumulative spending figures has reversed, which means that, in principle, the annual fee updates would be reduced and could be negative.
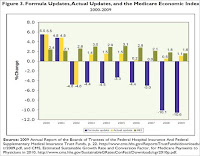
The next chart, taken from the same source, illustrates the relationship between the fee updates dictated by the S.G.R. formula, the actual fee updates passed into law by Congress year after year, and the M.E.I. index of medical-practice costs.

It will be noted that in 2002, Congress actually allowed the S.G.R. formula to dictate the fee update, which spelled a reduction in the conversion factor of 4.8 percent (compare the yellow and the blue bars for that year). It must have come as a shock to physicians. Note that the M.E.I. index for that year rose by 2.6 percent (the green bar).
Thereafter, however, Congress has year after year overridden its own S.G.R. formula with annual legislative “doc fixes,” as a comparison of the blue and yellow bars for these years shows. In common parlance, Congress has kicked the can of budget maintenance down the road year after year, in the process making a mockery of the entire S.G.R. construct.
Because under the S.G.R. construct the annual Medicare fee update (the change in the fee-schedule conversion factor) is to be adjusted not only for the prior year’s difference between actual and S.G.R.-allowed spending on physician services, but also for part of the cumulative differences in these spending figures as of April 1, 1996, the resulting update for calendar year 2011 should, in principle, have resulted in the previously mentioned 25 percent reduction in fees.
But once again common sense triumphed over an equation and Medicare fees will stay at the level to which they had been raised earlier in the fall.
And why this recurring drama over Medicare fees? The chart below provides a clue.
 Source: Staff presentation at Dec. 2, 2010 meeting of Medicare Payment Advisory Commission
 After all, that line is so much lower than the green line, which represents growth in the M.E.I., the index that measures the annual increase in the cost of operating a medical practice. The American Medical Association believes that the annual fee updates should be based on that index rather than the S.G.R. formula (see “Definitions” in this presentation). At first glance, this recommendation has intuitive appeal.
Indeed, even if one assumed that the M.E.I. should be adjusted downward a bit because physicians should be able over time to increase the productivity with which practice inputs are used, basing fees on the productivity adjusted M.E.I. (the blue line) would still have raised Medicare’s physician fees substantially more than the actual fee increases.
Finally, however, the top line (in black) shows that, in spite of Medicare’s miserly fee updates, total Medicare spending on physician services per Medicare beneficiary actually has grown by fully 60 percent from 2000 to 2009, at an average annual compound rate of 5.4 percent.
That per-beneficiary spending increase looks anything but miserly. Thus, after blushing over miserly fee updates, taxpayers might go on to ask physicians why an average annual compound increase of 5.4 percent in spending per Medicare beneficiary was not enough to give the nation’s elderly good medical care and, if it was not enough, what would have been an adequate annual increase in Medicare spending on physician services — perhaps 7 percent, or 10 percent, of 15 percent, or how much?
Might not a nation breaking under the load of its rising government deficits and private health care spending want to know how much health spending would be enough in the eyes of its physicians?
The difference between the growth in Medicare fees and the growth in Medicare spending is, of course, the growth in the volume of services sold, so to speak, to Medicare. I shall have more to report on it in my next post.
Uwe E. Reinhardt is an economics professor at Princeton. He has some financial interests in the health care field.

0 Comments:
Post a Comment
<< Home